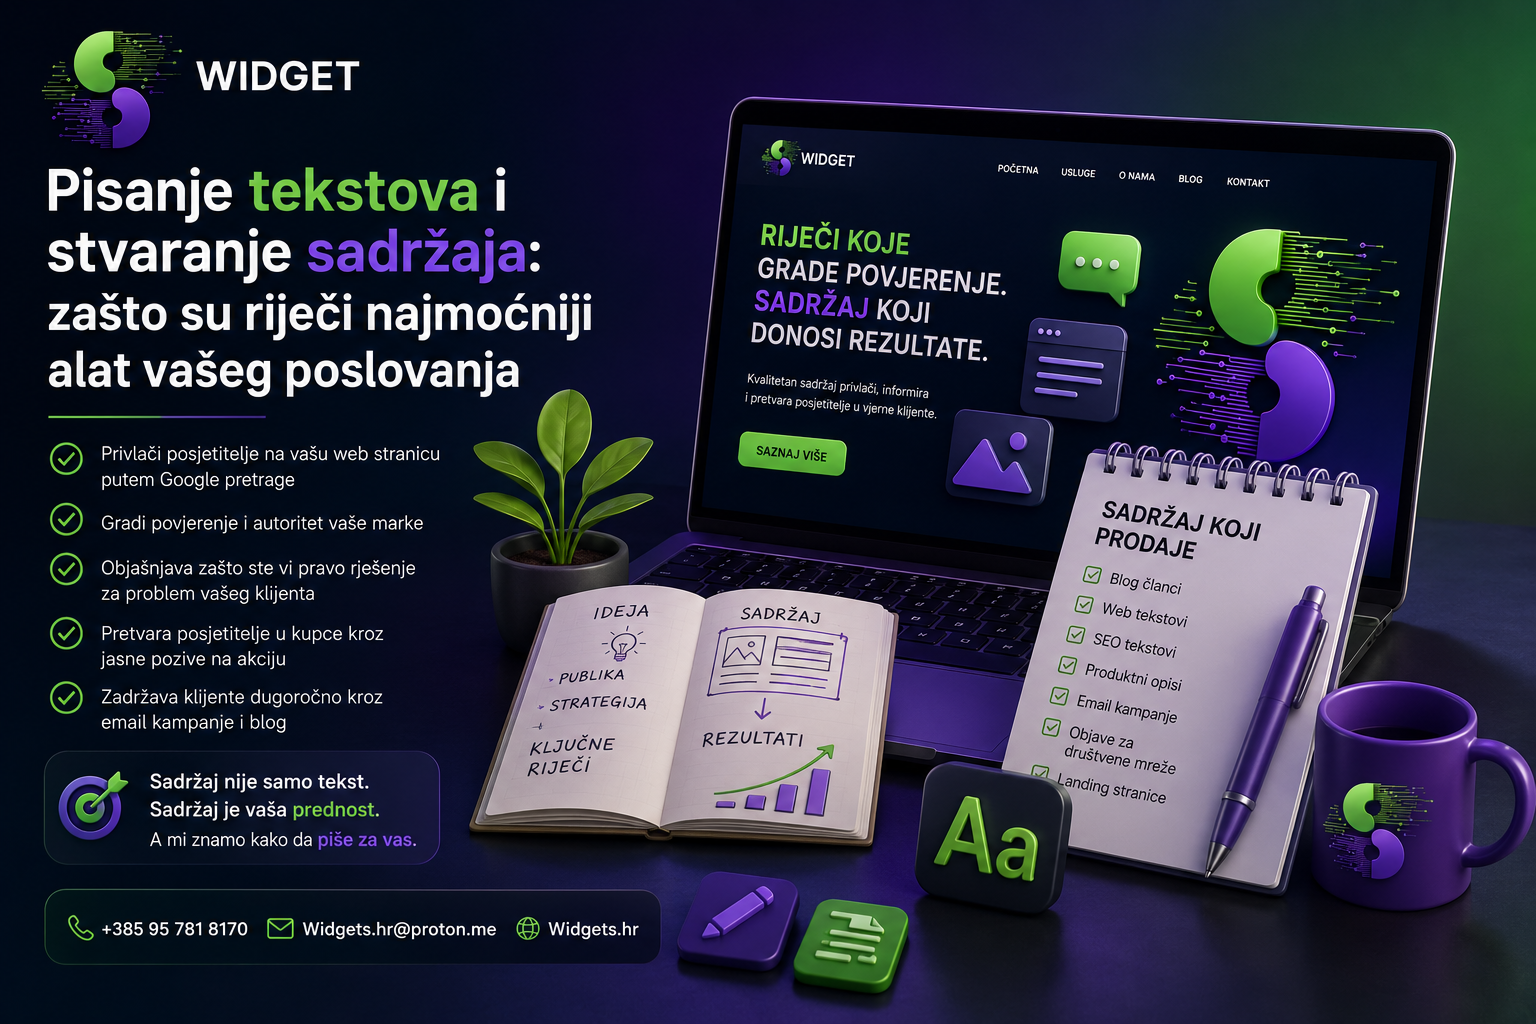
What is web analytics and why do you need it?
You have a nice website. You post on social networks. You may even be paying for Google ads. But one key question remains unanswered: do you actually know what's going on on your website? Who visits it, where does it come from, what does it do, and why does it leave without contacting you?
If you don't know the answer to these questions, you're not managing your digital business, you're just hoping. Analytics and reporting are tools that turn speculation into knowledge and knowledge into growth. At Widget, we help businesses understand their data every day and make smart business decisions based on it.
Web analytics is the process of collecting, measuring, and analyzing data about user behavior on your website. She answers questions such as:
- How many people visit your site and where do they come from?
- Which sites do they visit the most and how long do they stay?
- What percentage of visitors become customers or contact you?
- What keywords drive traffic from Google?
- Which campaigns bring results, and which spend money without effect?
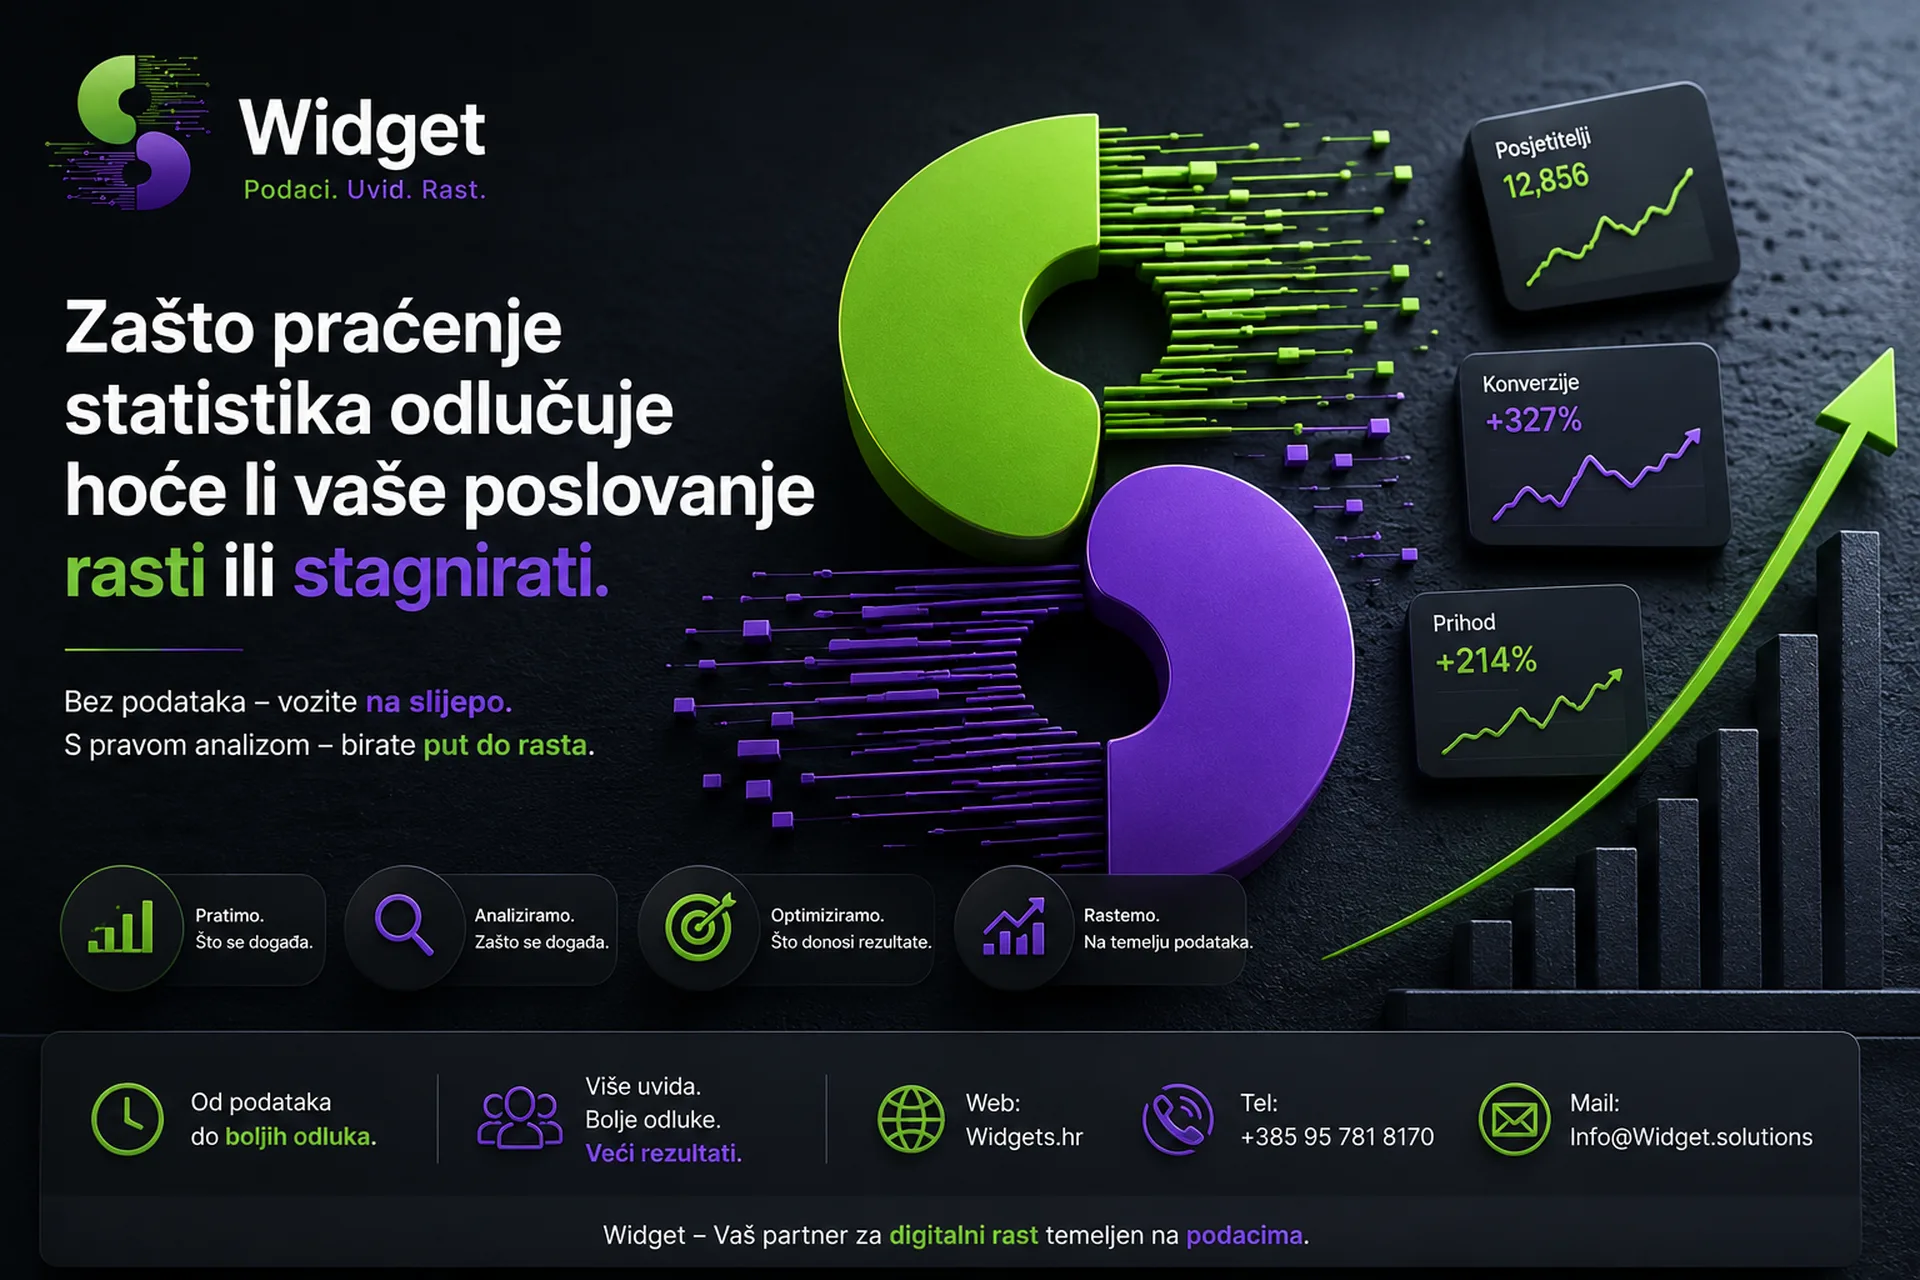
Without this data, any marketing decision is a shot in the dark. With them, you know exactly where to invest your energy and budget.
Tools that the Widget uses for analytics
Google Analytics 4
Google Analytics 4 (GA4) is the most powerful free web analytics tool on the market and the standard that Widget sets for all clients. Unlike the older version, GA4 tracks the user journey across different devices and sessions, giving a far more complete picture of visitor behavior.
What GA4 measures and monitors:
- Number of users and sessions in a certain period of time
- Sources of traffic (Google search, social media, direct visits, email campaigns, paid ads)
- Behavior on the site (which pages are viewed, for how long, in what order)
- Conversions & Events (contact forms, clicks on phone numbers, purchases, downloads)
- Demographics (age, gender, location, device of the user)
- Bounce rate (bounce rate) and the average duration of the visit
The widget not only installs GA4 but configures it properly, setting up all the key conversions and events specific to your business. Many companies have GA4 installed but have never set it up properly, which means they are looking at incomplete and erroneous data.
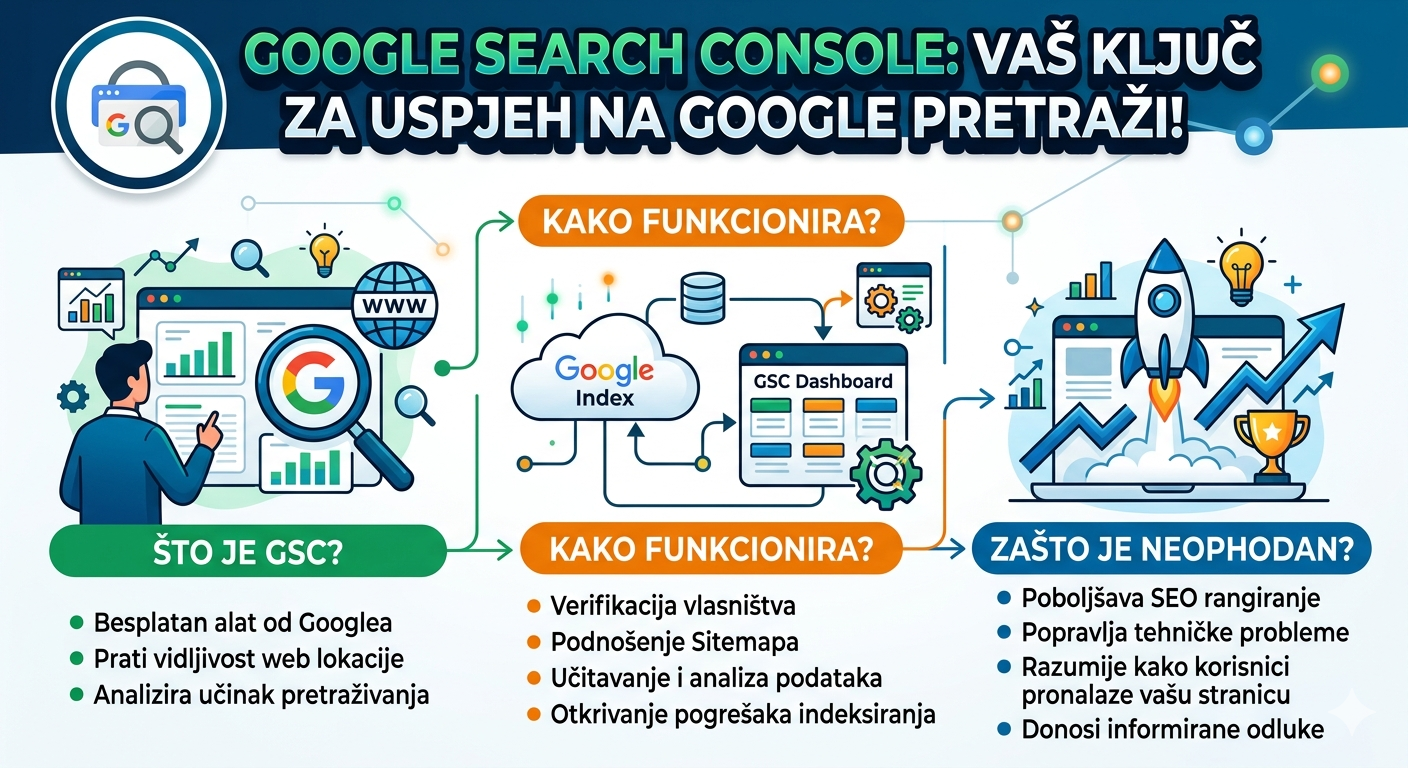
Google Search Console
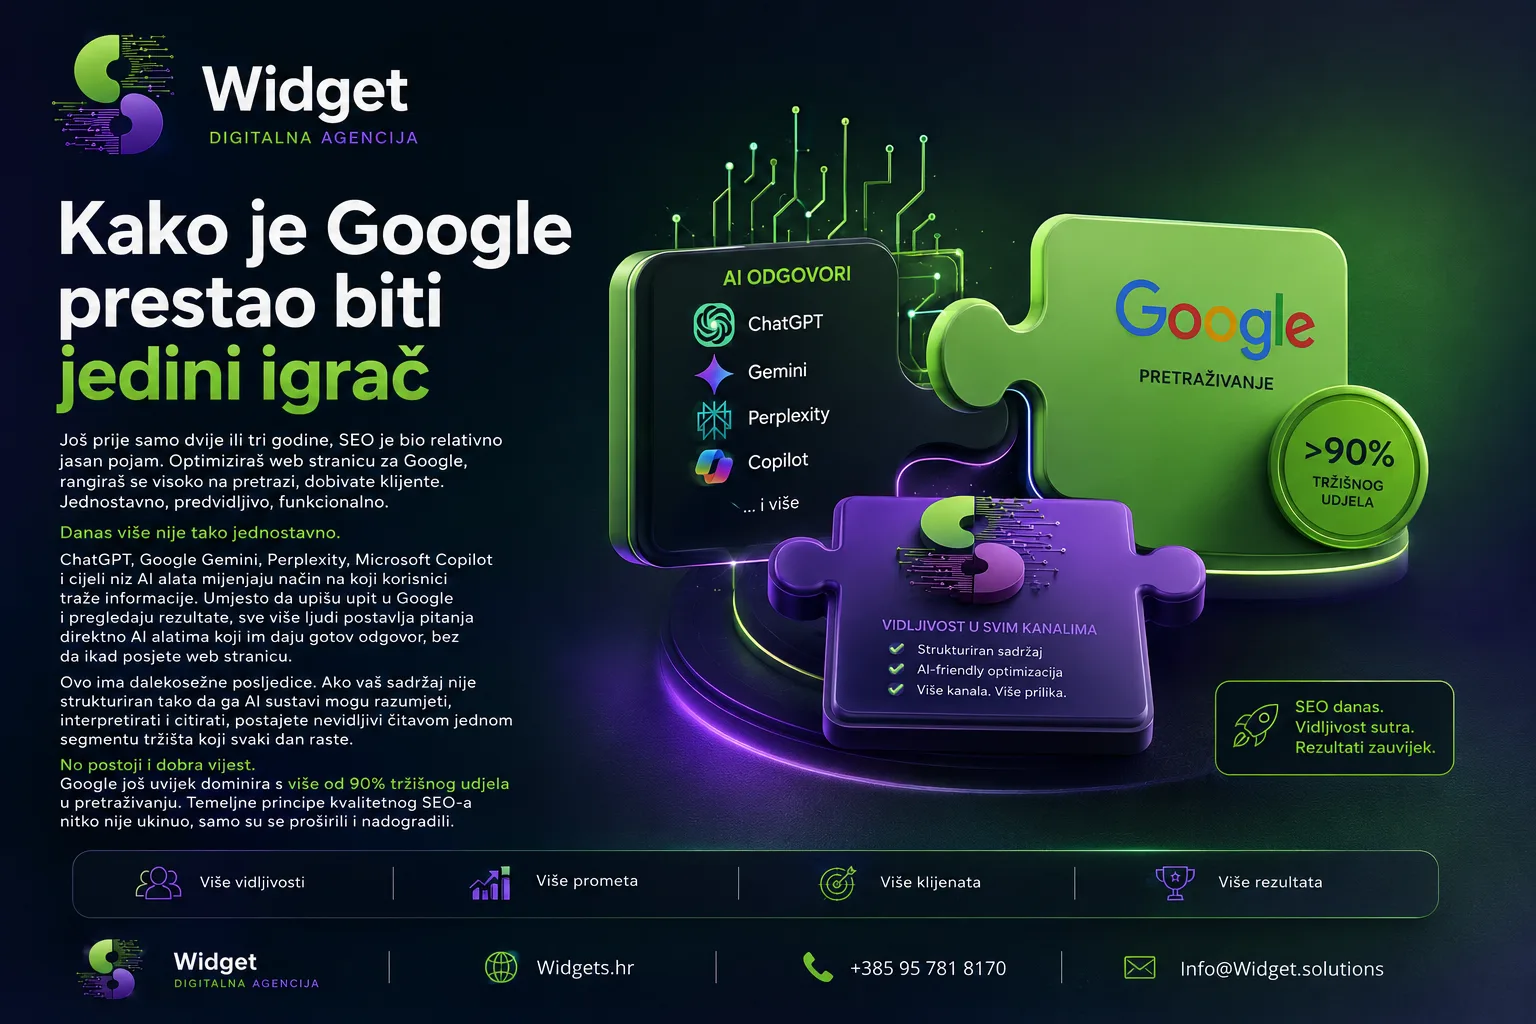
While GA4 tells you what users are doing on your site, Google Search Console reveals how Google sees you and how visible you are in searches.
Search Console shows:
- What keywords bring organic traffic to your site
- In what position You're going to show up for certain searches.
- How many clicks and views you get from Google search
- Technical errors that Google detects on your page (crawl errors, mobile display issues, speed)
- Backlink profile and external sites that link to you
The combination of GA4 and Search Console gives a complete picture, from the moment a user types a query into Google to the moment they convert on your site.
Heatmap and behavioral analysis
In addition to these standard tools, the Widget also uses heatmap analysis tools that visually show where users click, where they scroll and where they "get stuck" on the page. This is extremely useful for discovering why visitors aren't filling out a contact form or completing a purchase.
Conversion Analysis and Optimization (CRO)
Analytics in itself has no value if no action is taken based on it. This is where conversion analysis and optimization, known as CRO (Conversion Rate Optimization), comes in.
CRO is the process of improving a website with the aim of making a higher percentage of visitors a customer, lead, or contact. For example, if your page is visited by 1000 people and only 10 contact you, your conversion rate is 1%. By improving design, texts, speed or user experience, this rate can rise to 2%, 3% or more, without spending an extra euro on advertising.
The widget performs a CRO analysis that includes reviewing data from GA4, heatmaps, testing different versions of pages, and specific recommendations for improvement.
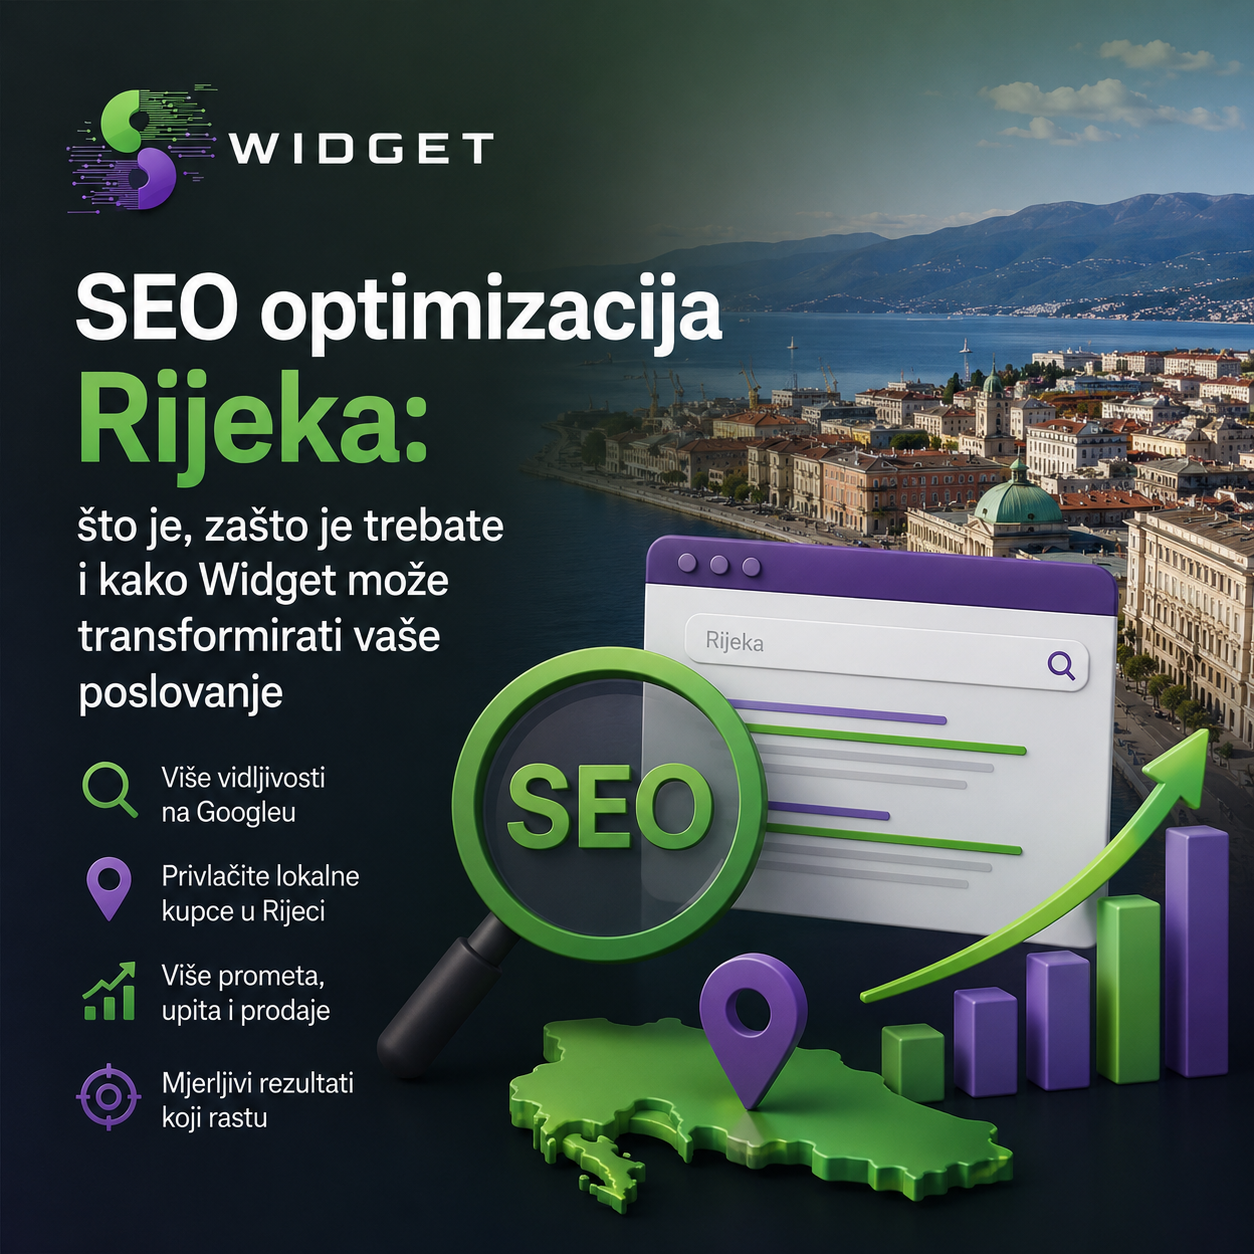
Keyword Ranking Monitoring and Analysis
Do you know where your website is currently ranking for the terms your customers are searching for? Do you track changes over time? Do you see the impact of your SEO activities on rankings?
The widget sets up a keyword tracking system that allows you to always have a clear picture of your search visibility. We monitor positions, analyze trends and compare you with the competition to know where there is room for improvement.
Competitor and keyword analysis
A good analytical approach looks not only inwards, but also outwards. The widget conducts a detailed analysis of the competition that reveals:
- Which keywords are your competitors using and ranking for
- Where do they get traffic and backlinks from
- What content they create and what brings them results
- Where are your opportunities for differentiation and advancement
This analysis becomes the foundation of any SEO and content strategy.
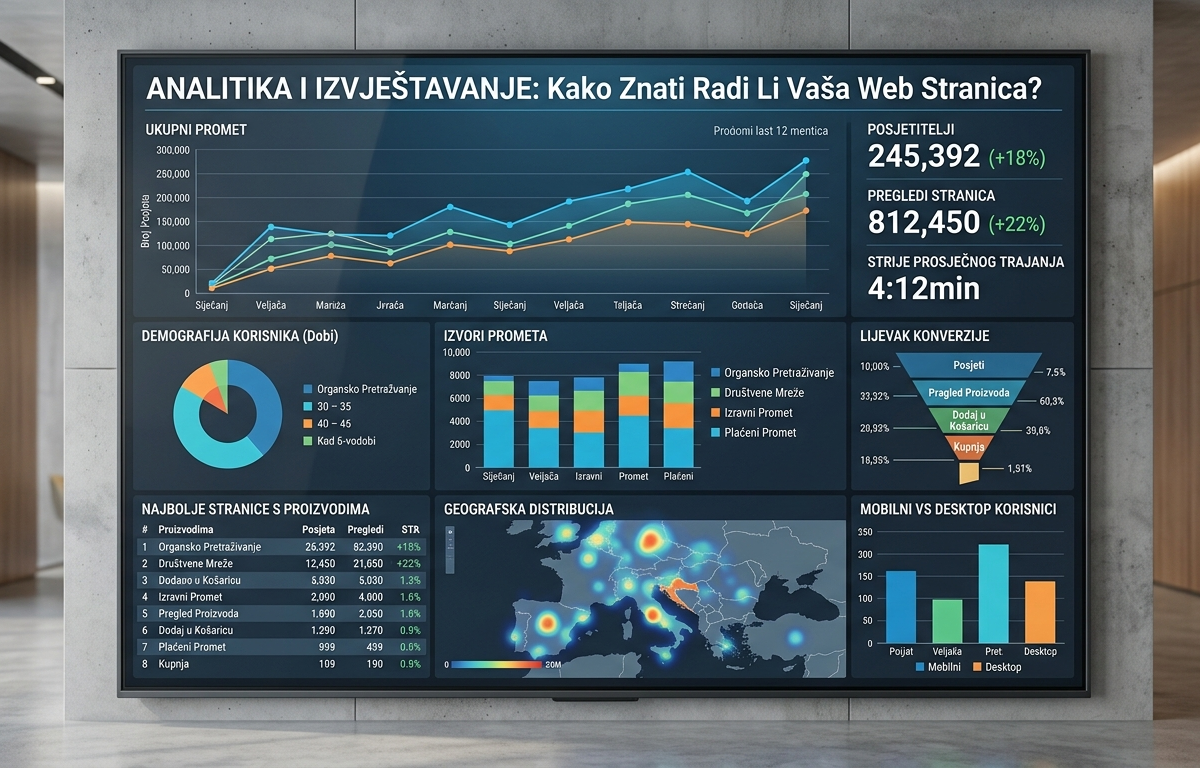
Monthly website performance reports
All of the above is collected in one place, in your monthly performance report that the Widget delivers to each client.
This report is not a bunch of illegible tables and numbers. It is a clear, concise document that shows you:
- How traffic has changed compared to the previous period
- Which channels bring the most visitors and conversions
- How Keyword Ranking Is Progressing
- What has been done in the past period and what are the results
- Specific recommendations for the next period
The goal is for every client, even without technical knowledge, to understand what is happening with their website and what the return on investment is.
Google Ads Analytics, integrated with the rest
For clients using Google Ads, the widget integrates data from ad campaigns with GA4 to have a complete picture. You can see not only how many clicks the ad brought, but also what those users did on the page, whether they converted, and what the actual cost per conversion is.
This is the foundation for smart budget optimization, because you know exactly which campaigns, ad groups and keywords bring profitable customers.
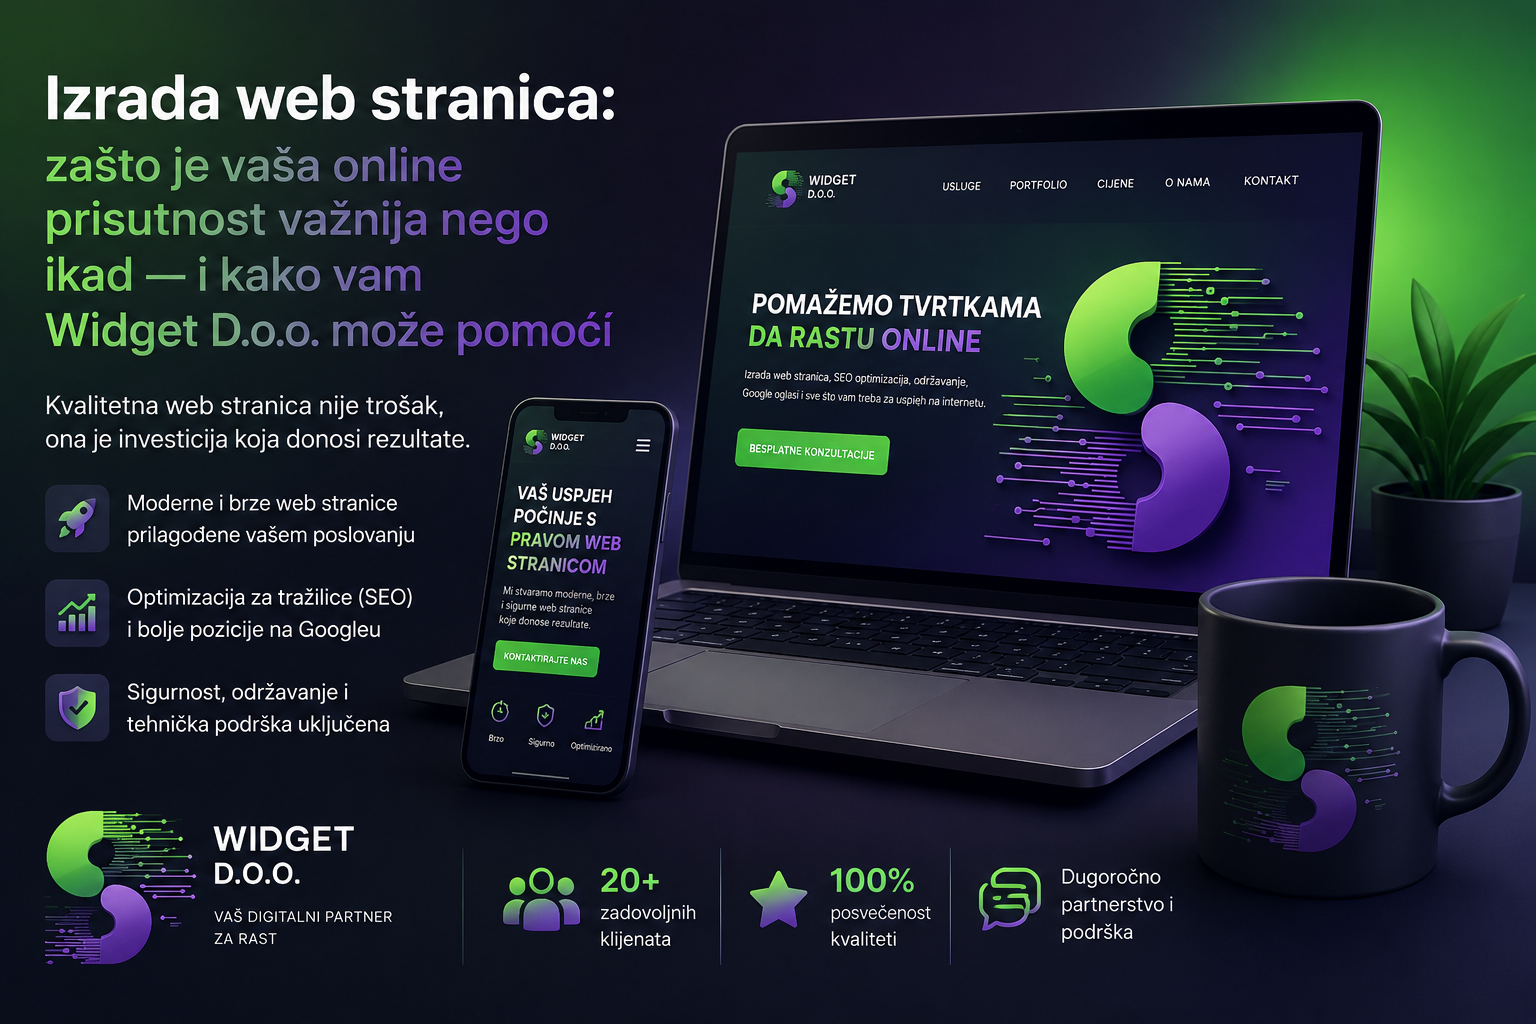
Why is analytics important for any type of business?
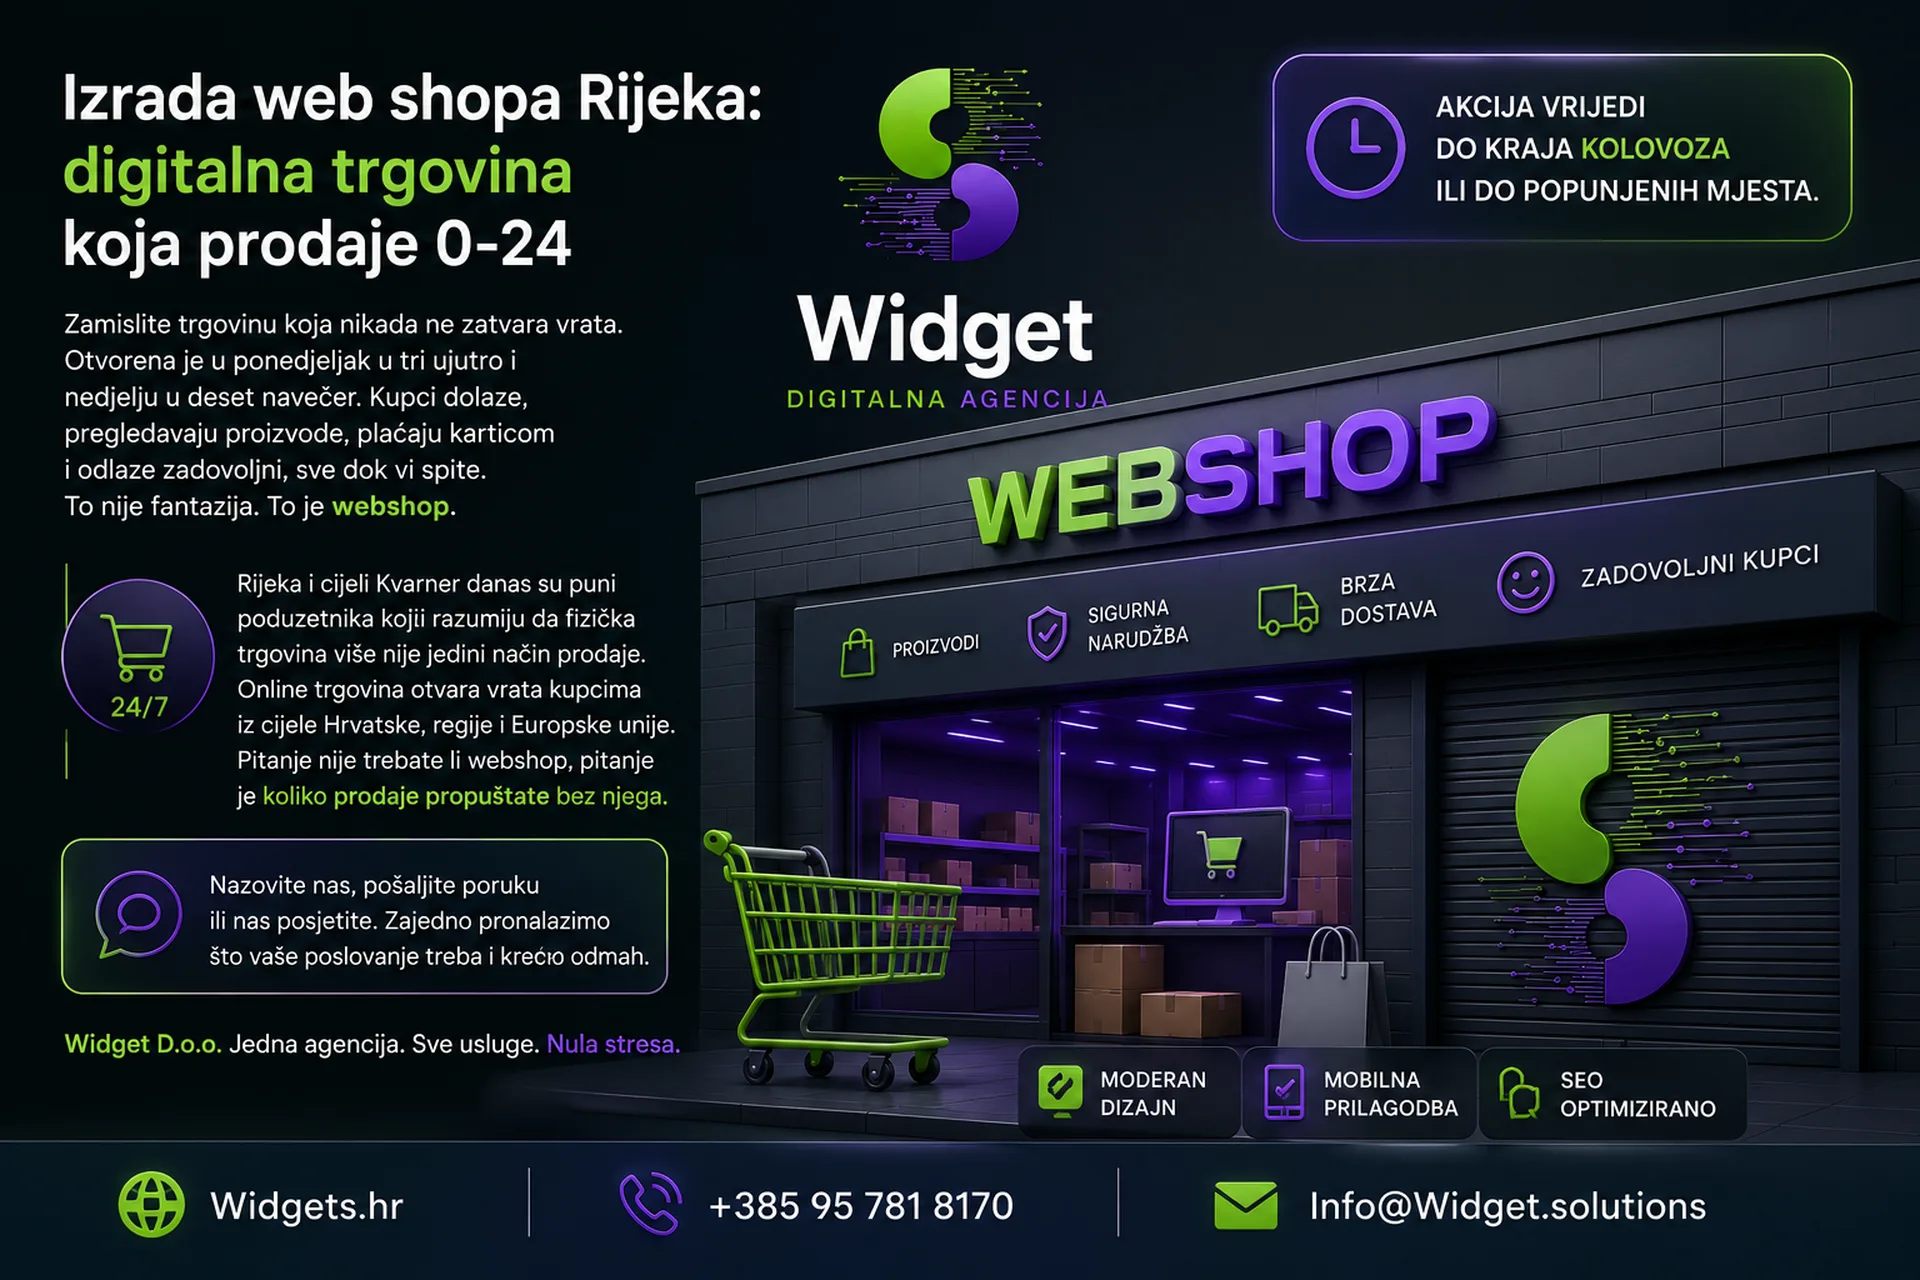
A common misconception is that analytics is only valid for large companies or webshops. The truth is completely different.
A local craftsman who gets 80% of clients through Google has the same need to know where these clients come from and what drives them to get in touch. A restaurant that wants more reservations needs to know if visitors are coming from Google Maps or Instagram. A company that is considering investing in Google Ads needs to know what organic traffic already brings so that it does not pay for something that it achieves for free anyway.
Without analytics, every decision is a guess. With analytics, every decision is informed and accountable.
How to get started with analytics with Widget?
The process is simple:
- Consultation where we discuss your goals and current tracking status
- Setup and configuration GA4, Search Console and other tools
- Defining conversions specific to your business
- Regular monitoring and optimization Based on data
- Monthly Reports with clear conclusions and recommendations
All you need is one phone call.
📞 Contact: +385 95 781 8170 🌐 Web: widgets.hr
Analytics and reporting are not a luxury reserved for corporations. These are tools that allow any business, regardless of size, to grow smartly rather than randomly.
Widget provides you with a complete analytical solution, from setting up tools to interpreting data and specific actions for improvement. Stop guessing. Start knowing.
Widget, one agency. All services. Zero stress.